Know exactly what's working in your business.
Built-in reports give you clarity on revenue, jobs, customers, team performance, and territories, with custom date ranges and one-click export.
7 report types
Revenue to operations
Custom date ranges
Pick any period
One-click export
CSV and PDF
This month
Revenue up 18%
Business Reports
7 reports
$24,180
This month
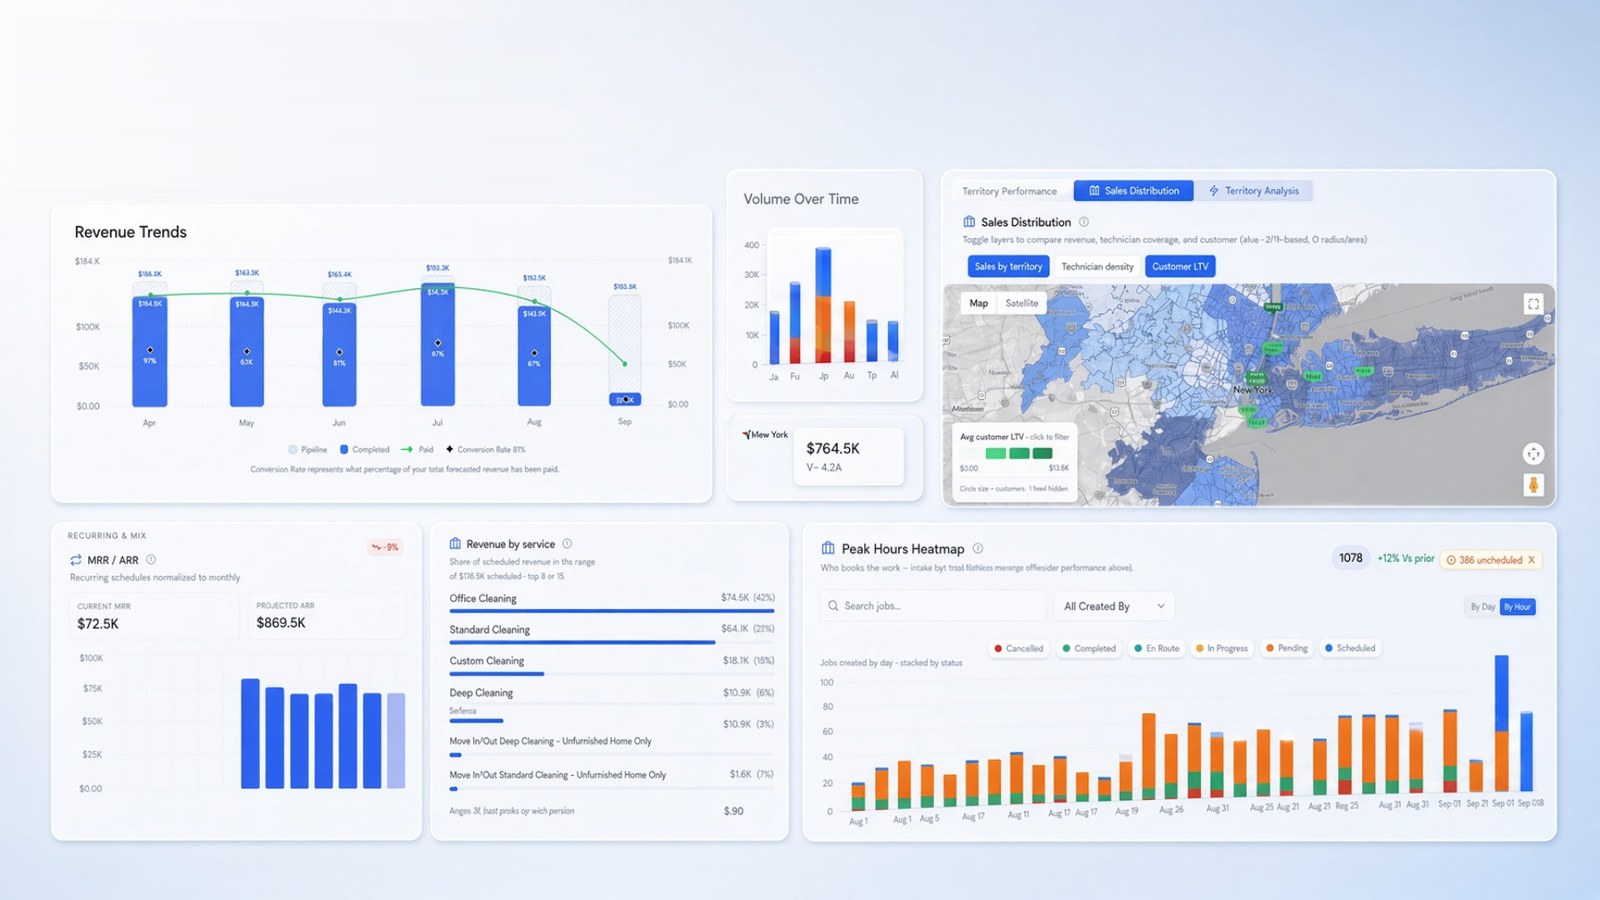
KlientHQ Reports show revenue, jobs, customers, team performance and territories, with custom date ranges and export, in one dashboard.
The problem
Running a business without data is just guessing.
Most field-service owners make critical decisions based on gut feel. That works until it doesn't.
Without insights on your business, you might be stuck with:
- ✕No idea which services are most profitable
- ✕Can't tell if your team is growing or slipping
- ✕Revenue feels unpredictable month to month
- ✕No visibility into which territories underperform
With KlientHQ Reports
- See revenue trends by service, quote conversion, or completion rates
- Track team productivity and spot issues early
- Understand exactly what's driving growth
- Export any report in one click
What's included
Seven reports. Every angle of your business.
All reports support custom date ranges and export. Team-level reports are permission-gated so you control who sees what.
Revenue
Track gross revenue, collected payments, outstanding invoices, and refunds. Drill into any transaction to see what's driving income.
Avg. businesses identify $1,200/mo in overdue invoices
Jobs
Monitor job completion rates, average duration, rescheduling frequency, and which job types take the most time to service.
Spot recurring delays before they become customer complaints
Customers
Understand retention rates, booking frequency, customer lifetime value, and which customers haven't returned in 90+ days.
94% avg. retention rate for businesses using this report
Team
See payroll summaries, jobs completed, hours logged, customer ratings, and on-time rates for each team member.
Identify top performers and coach those falling behind
Territory
Compare performance across your service territories. See which areas generate the most revenue and which are underperforming.
Prioritize marketing spend where demand is highest
Services
Break down revenue and job volume by service type. Find your most profitable offerings and which ones cost more to deliver.
Most businesses find 1 to 2 services driving 60% of profit
Operations
A birds-eye view of overall business health: quote-to-job conversion, average invoice value, repeat booking rate, and more.
The single dashboard owners check before planning each month
3h
Saved per week on bookkeeping
94%
Customer retention rate
Avg. results across KlientHQ businesses using Reports weekly.
How it works
Your data is already there. Reports just shows it.
Data populates automatically
The moment you start using KlientHQ for jobs, invoices, and customers, Reports starts tracking. There's nothing to configure. Every job, payment, and customer interaction is captured and organized for you.
No spreadsheets. No manual entry. Zero setup time.
Choose your report and set a date range
Pick a report, select any date range. That's it. The report renders with up-to-date data.
Day, week, month, quarter, or fully custom date ranges.
Share with your team or export in one click
Permission-based access means your team only sees what they need to see. Export any report as a CSV or PDF in one click, ready for your accountant, investor, or quarterly review.
CSV and PDF export. Permission controls per role.
Let the numbers drive your next move
Stop making pricing, hiring, and marketing decisions based on feel. Reports surfaces the trends you'd otherwise miss, giving you the confidence to act on what's actually working.
Updated as new jobs and payments come in.